Saturday, September 18, 2010

USDindex update - 27Mar2011

USD index update - 27March 2011 Aus
This is a combined format analysis of the USDindex (US Dollar basket, USDi), that includes COT analysis for the index and 7 related currency pair components. This is a definitive consolidated examination of the USDindex that incorporates in depth daily and hourly trend analysis as well as COT assessment the underlying instruments. For a definition of the ICE exchange traded USDindex go here. As you will see, it takes some time to put together and is the result of more than 12 months of private research ... my summary is down the bottom.

Preamble: I use the USDindex (USDi) as one of several critical broader market indicators, and not just for currency trading. As well, I have developed 2 models using composite calculations based on 7 major pairs EU, UC, GU, UJ, AU, UCad, USek. As a result, the movement in the USDi explicitly requires corresponding movements mainly in EU, UC, GU, and UJ.

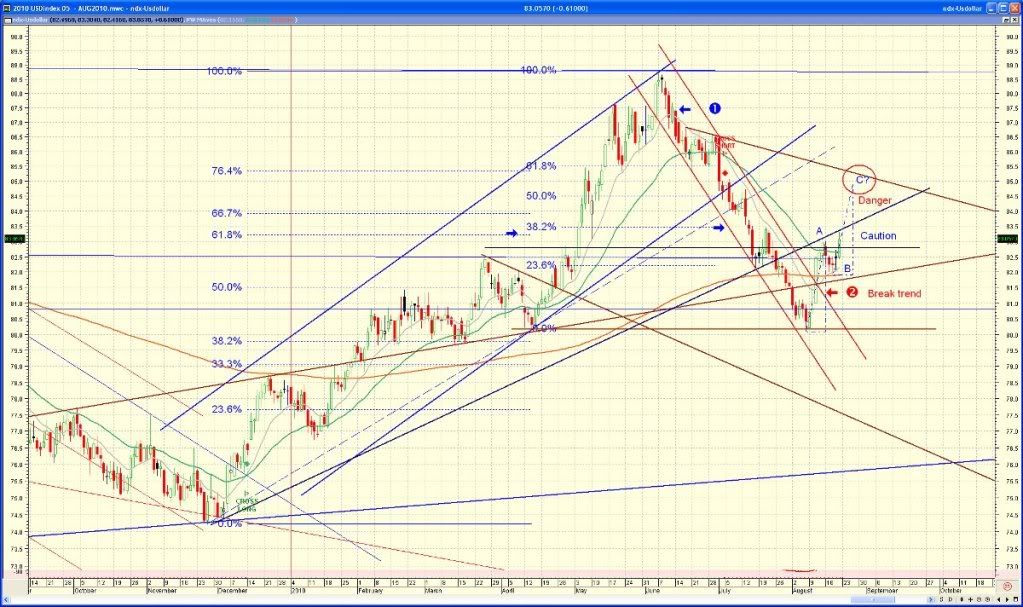
USDi Trend Summary - After the turbulence subsided from the recent March expiry (triple witching week 14-18Mar) - the June USDi contracts turned over with a +0.3c premium above March. The trend remains obviously down having broken below a 3 year support line back to Mar2008. It has no immediate support and is positioned slightly above midway in a strong down channel. The USDi trend has a recent habit of shocking various broader markets on trend breaks.

USDi daily chart - click to expand
USD index daily - click image

USDi is currently threatening to break the recent down move. It is hardly going to race upwards quickly from this position unless a black swan occurs with a rush of panic in response to a new threat not previously known. RSI and Slow Stochs are turning up from touching overbought levels indicative of the recent support showing in the USDi, and are now showing bullish divergence since the November 2010 (higher) low at 75.6.

This looks to break the recent downward move, but has a long way to go to establishing a new longer term up trend which is above the 233 EMA around 79.0 at that time. Regaining the 3 year support line above 77.0 would be a concerning sign of growing USD interest and would put equities and commodities on notice. Technically, a turn up from here would not surprise (fundamentally it is a different matter).

(A comparison to the 1995 Kobe earthquake quarter is on a separate blog created a few weeks ago, but I am yet to publish. Will update this part when I do)

Daily USDi chart on stockcharts.com - here

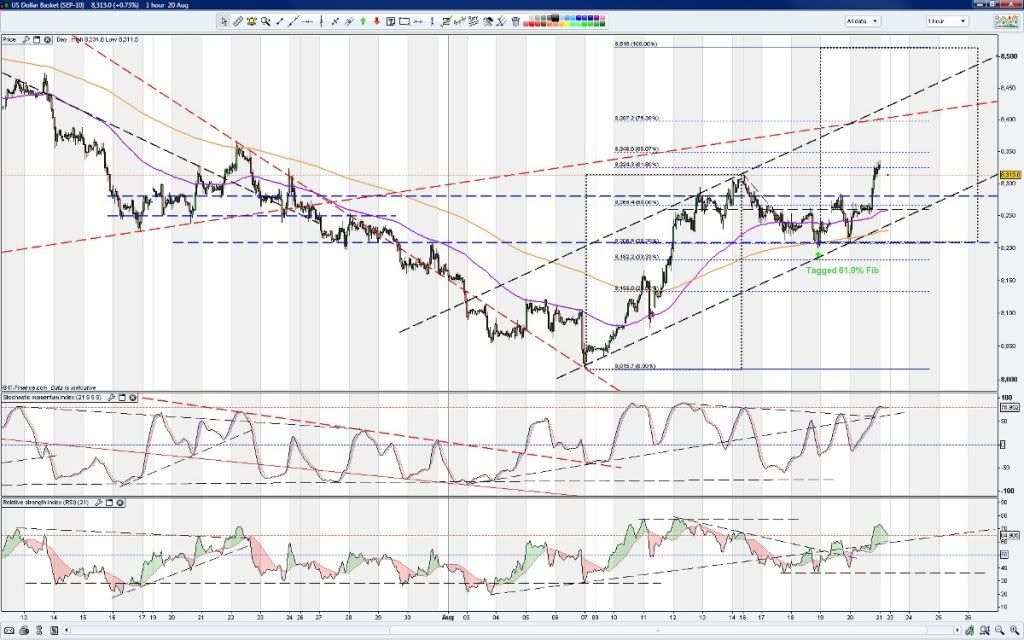
USDi hourly chart - reduced due to data source of new June2011 contract
USD index 1hour - click image

Targets - I remain overall bearish on the USdi but a sharp rally might spook everyone so it's worth watching closely; nearest horizontal support below at 74.3, with the previous historical low of 71.0 below it (a technical low of 61 is actually possible, but unlikely. Below 71 isn't). Reclaiming the 3 year upward trendline above 77 would negate this tantalising prospect. I'm favouring a failed H&S target of 72.0.

USDi COT data 22Mar2011 - here to view USDi COT chart
Open interest increased marginally (1,769 or 3.4%) to 53,140 (76.3% of previous peak 69,674 in Feb2010). The USDi is dominated by speculators, moreso the Large Speculators holding 66.2% of all positions. All new trades were added by speculators - mainly Large Specs adding longs matched by new Small spec shorts. Large Specs continue to disagree with Small Specs, however Small specs are now evenly undecided. Net positions narrowed marginally but are still historically closer to zero (<30% of range, not extreme). Importantly, Commercial reduced both long and short positions overall by 4.4% and are now only 22.9% of the USDi trading, being themselves 3.5:1 nett long. Large Specs are themselves 1.5:1 short, while Small Specs are almost evenly split net zero (short 5,710, long 5,716). All this indicates increased uncertainty and likely increased volatility ahead with weak support for the USDi. The Small Specs are fence sitting amongst the current uncertainty. Indicative of the chart trends above, the USDi is lacking support of any kind - especially support for a change in trend. This is likely to change if Commercials begin to increase their interests one way or the other. Large Specs will position themselves opposite Commercials when they do - closing out the losing side of any trend change. Sentiment sits with Large Specs until then - being short and down.
________________________________________


THE COMPOSITE MAJOR PAIRS
There are 2 models I use for the USDindex. As a result of bifurcation, the 4 pair model differs from the 7 pair model but both result in good approximate trend for the USDi. According to my estimations, construction of the USDindex from the major pairs is roughly as follows - EURO 35%, CHF 35%, GBP 15%, JPY 10%, others 5% using the 4 pair model. The 7 pair model is recently new and throws up some interesting contrary assessments that I am yet to fully correlate into firmer understanding.

EURUSD (EU) - the EU carries a major influence within USDi analysis, more than any other single pair. I have no position currently, but for me long is expected to continue (based on accepting the above downtrend continuation in the USDi). Broadly the EU is currently in a strong upward trend in an overall long term down trend. Rising wedge forming in the right hand edge of a cup formation. If support holds above 1.386, and 1.434 is breached, I then expect somewhere up towards 1.50 to be a target for a reversal. Currently sitting at midpoint of a rising channel bracketing this rally. There is overhead downtrend resistance at 1.434. RSI is trending just below overbought levels, with the Stochastic overbought for nearly 3 weeks now. We are in reversal territory, but it might be too early.

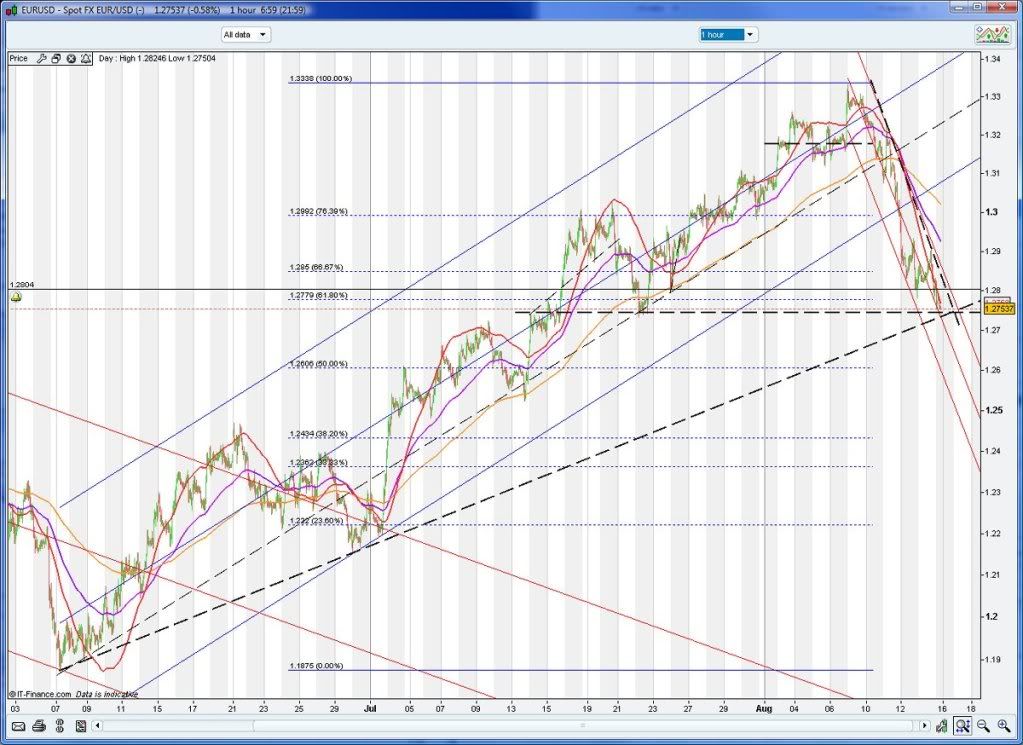
EURUSD daily chart - click to expand
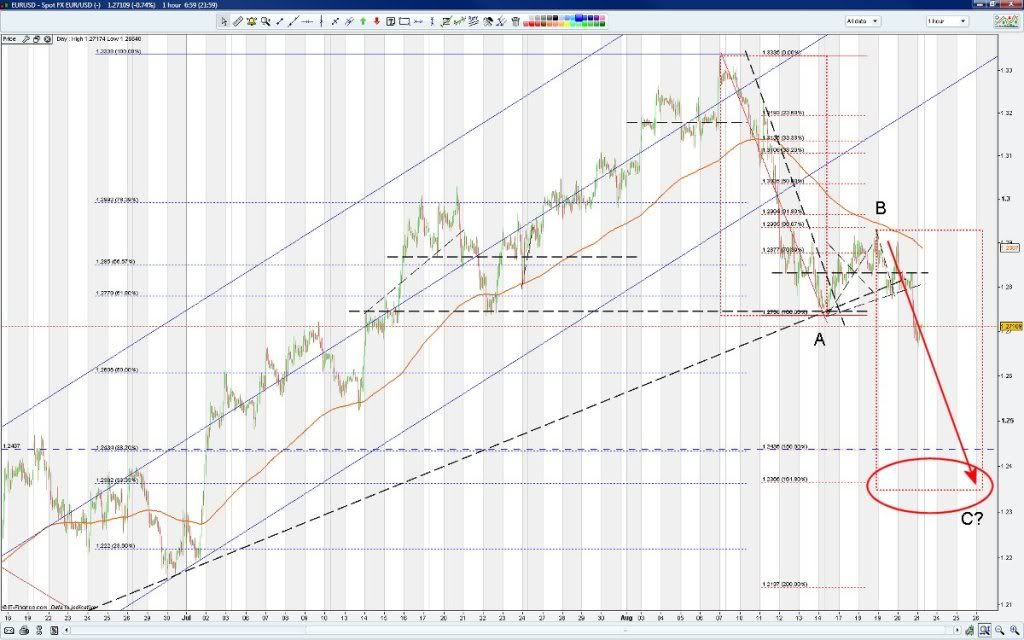
EURUSD daily - click image

EURUSD 1hour chart -
EURUSD daily - click image


EU 1hour pushing into the top edge of the rising wedge, strong -ve divergences appear in both RSI and Stochs, however the 1hour appears to be becoming oversold. It's hard to imagine precipitous falls in the EU from here. Upwards for me if 1.40 holds.

Targets - bearish for EU is a lower support around 1.386. Bullish target is 1.50, with 1.45 minimum on a breakout of 1.434.

EURO FX COT data 22Mar2011 - here to view EURO FX COT chart
NOTE: EUR COT data indicates the same as the EU trend, being the interest in the EUR component only
Open interest increased moderately (11,814 or 5.2%) to 240,256 (55.7% of previous peak 431,261 in May2010). This rally has forced the closure of a very large short position held by the Large Speculators at the bottom in Jun2010 at 1.20. This week Large specs decreased both positions, reducing more shorts to now remain net long 3:1 (a switch to net long occuring in Jan2011). New trades this week were mostly new long positions by commercials, who remain net short 2:1. Overall net positions narrowed marginally sitting roughly 50% of peak range - with Large and Small specs being net long 2:1 overall. New Commercials positions this week were long 2:1, increasing their participation to 42.4% of EU FX trading (remaining nett short). The biggest single change was new long positions by Commercials. This confirms a continuing trend in the EU. Comparison to the EU rally in 2009 indicates in increased likelihood of upwards. Small speculators have reduced longs and opened shorts to remain long by the smallest margin. So are likewise spooked by current affairs. EU fx is marginally overweight to speculators.

While I don't understand the 3month EURODOLLAR - assuming it is a 3month futures type instrument, the Commercials are the major stakeholder (68.4% of this market) and are fractionally nett short. Large Specs are 2:1 long on 6.5% of market with a large 17% spread position. Small specs are fractionally net short on 24% of this market. All indicating a swing either way is likely. Worth watching if this trend is the future.

USDCHF (UC)
The UC is firmly in a multi year long term down trend (now in it's 10th year) indicating the continued strength of the CHF over increasing USD weakness. Have traded the UC on and off since 1.05 with reasonable success, but having learned a few things incorporating COT data has helped me trade the volatility in the UC.

For the USDi to go lower then UC would need to at least hold, or go even lower on a rising EU. On the daily UC, a low of 0.847 is not unexpected which would allow this. Current UC charts indicate it might be testing the upper edge of the trend channel/falling wedge. Short term bullish.

If the UC rises, it cancels any effect of a rising EU and the result is USDi holds steady. I suspect UC up with EU possibly slightly weaker in the short term. Strength in the USD has to come from failing CHF and failing EUR.

USDCHF daily chart - click to expand
USDCHF daily - click image
Alternative USDCHF daily chart with clearer short term patterns here
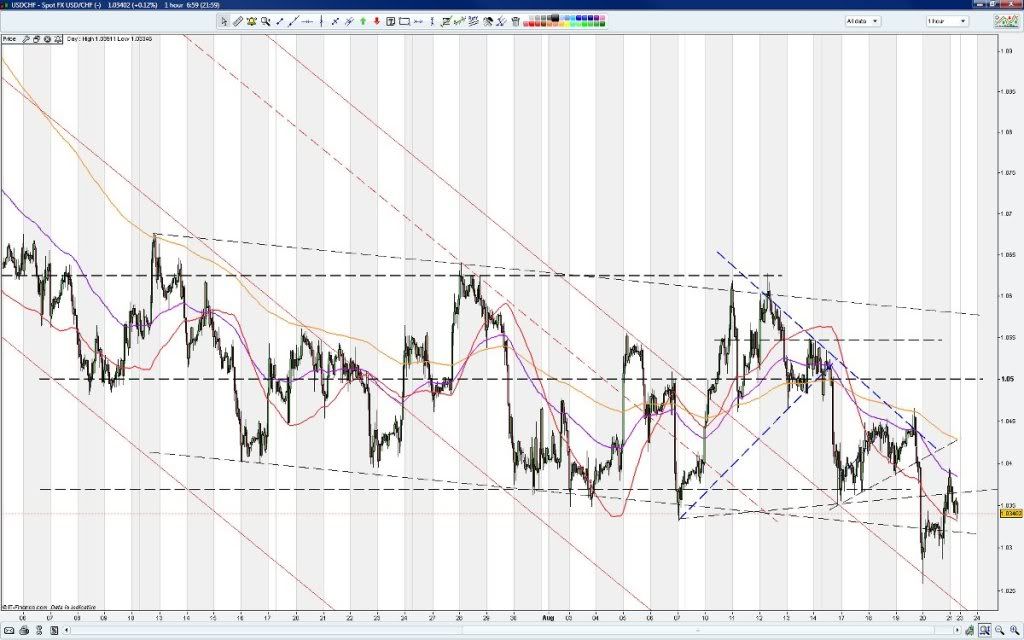
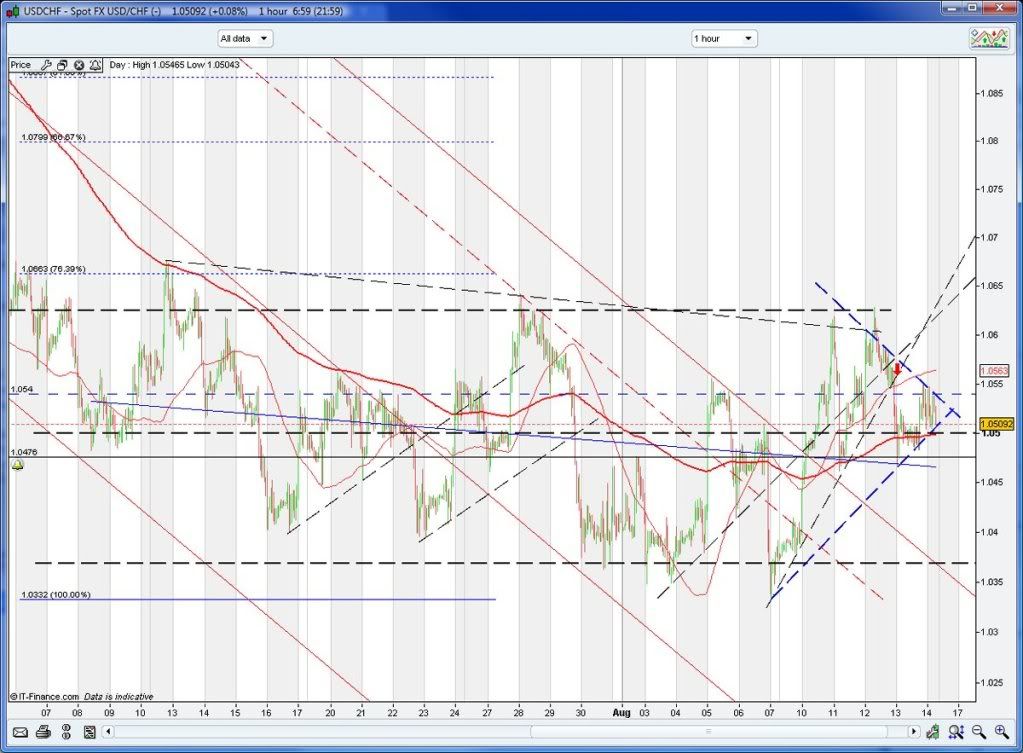
USDCHF 1hour chart
- flag breakout and channel breakout in the UC (a weaker CHF) occurred in Friday nights trading
USDCHF 1hour - click image

Bottom of long term falling channel at 0.847 is support. Above 0.94 (daily) would be a new up trend break of current down channel / falling wedge. Daily remains in a falling wedge in a bullish case.

CHF COT data 22Mar2011 - here to view CHF COT chart
NOTE: CHF COT data indicates the inverse of the UC trend, being the interest in the CHF component only
Open interest decreased moderately (-3,828 or -6%) to 59,701 (35% of previous peak 157,623 in Jun2007). The largest single change coming from Large Specs closing longs (but remaining 8:1 long CHF) matched by Commercials closing shorts (getting burnt!). This is profit taking by Large Speculators (or cutting losses by Commercials). Large and Small Specs hold 58.3% of total participation (with both nett long) , covering Commercials who are 8.5:1 nett short the CHF (expecting a USD recovery?). Net positions narrowing marginally and were historically quite extended(>90% of peak range). Large Specs reduced participation last week closing out 21% of previous positions (a large % change making Large Spec the smallest group now trading CHF). There is healthy support for continuation of trend - but closing positions (falling OI) could spell a trend change. Comparison to Nov2004 indicates an increased likelihood of a trend change in the near future. Commercial interest is 41.7% of this market. Small speculators remain 2.5:1 long CHF. Falling wedge in UC to watch for a convincing break, otherwise the trend remains down for the UC on the above.

GBPUSD (GU)
I do not trade the GU, as I do not keep up with news in the UK unless it is global. It is interesting that the GBP has held it;s own against the USD given one has austerity, and the other is freebasing on numerical increments of loose monetary policies. Maybe an indication of common sense prevailing? (one can only hope)

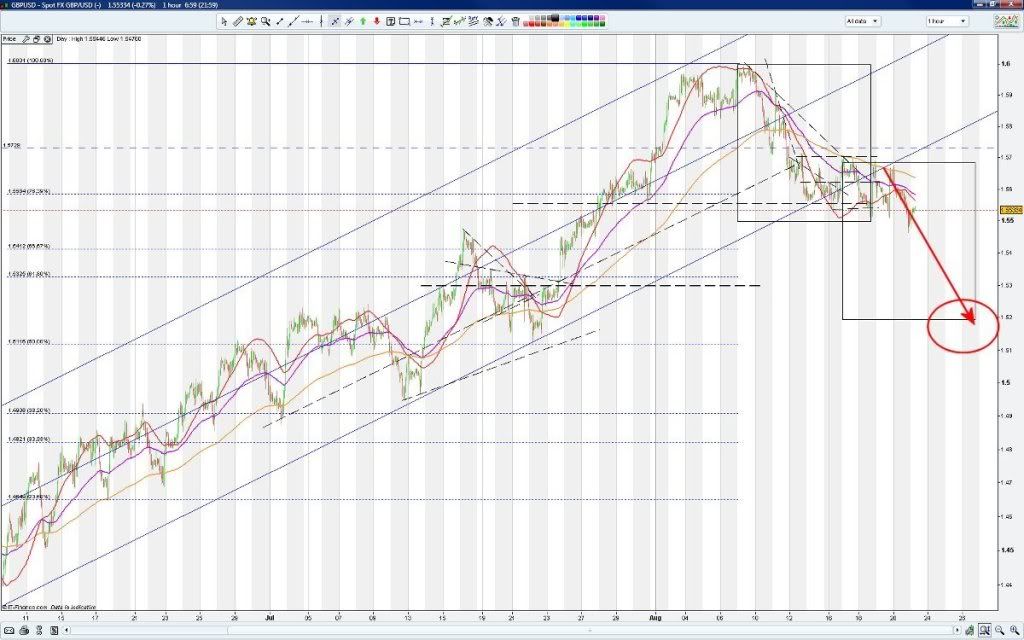
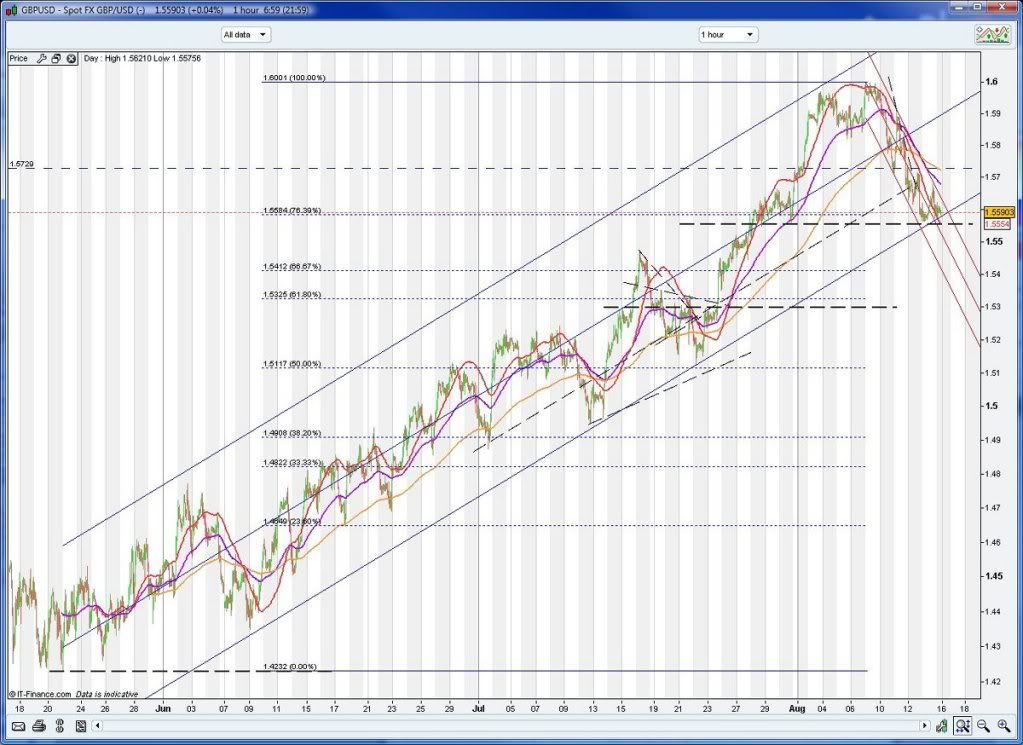
GBPUSD daily chart - click to expand
GBPUSD daily - click image

GBPUSD 1hour chart -

GBPUSD 1hour - click chart

Targets - Expanding range (hourly) inside an ascending triangle (daily). Support would be 1.583 from the daily in a short term bearish case. If the hourly support at 1.598 holds and the GBP targets towards 1.66 first (upper channel edge), it might suggest the reversal point for continuing down the trend channel.

GBP COT data 22Mar2011 - here to view CHF COT chart
NOTE: GBPCOT data indicates the same as the GU trend, being the interest in the GBP component only
A large increased in open interest by almost 20% (20,810 or 19.6%) to 126,884 (69% of previous peak 182,707 in May2007). This follows a large decrease in positions over the previous month. All groups increased positions this week, the largest increase by share going to Large Specs with a 34.8% increase in positions (all long, closed some shorts). The largest single change coming from Commercials adding shorts and closing out longs to increase to 2.3:1 short. Large and Small Specs control 54.4% of GBP trading, and are both roughly 2:1 long. There appears to be plenty of headroom in all caps, so I would side with the Spec traders in the short term.

USDJPY (UJ)
I love trading the AJ and UJ. Japan has a lot going on lately. It was attracting the wrong kinds of attention for justifiable reasons on paper earlier in the year ... and yet it has maintained a strengthening trend against the USD. This is a comon theme for many pairs - multi year strength against the eurphoric optimism peddled for the USD. Anyhow, sticking to the facts ...

Looking at Kobe market responses against many broad data streams, repatriation into Yen took several months. We are bigger, longer, and more indebted 15 years later, so perhaps a similar trend is yet to develop. The recent 1000 (+/- 500) pip roller coaster was rife speculation to me - pure and simple. I was short UJ in time, but foollishly though it would sustain the move. Even so, I managed to capture half the short profits before speculation intervened.

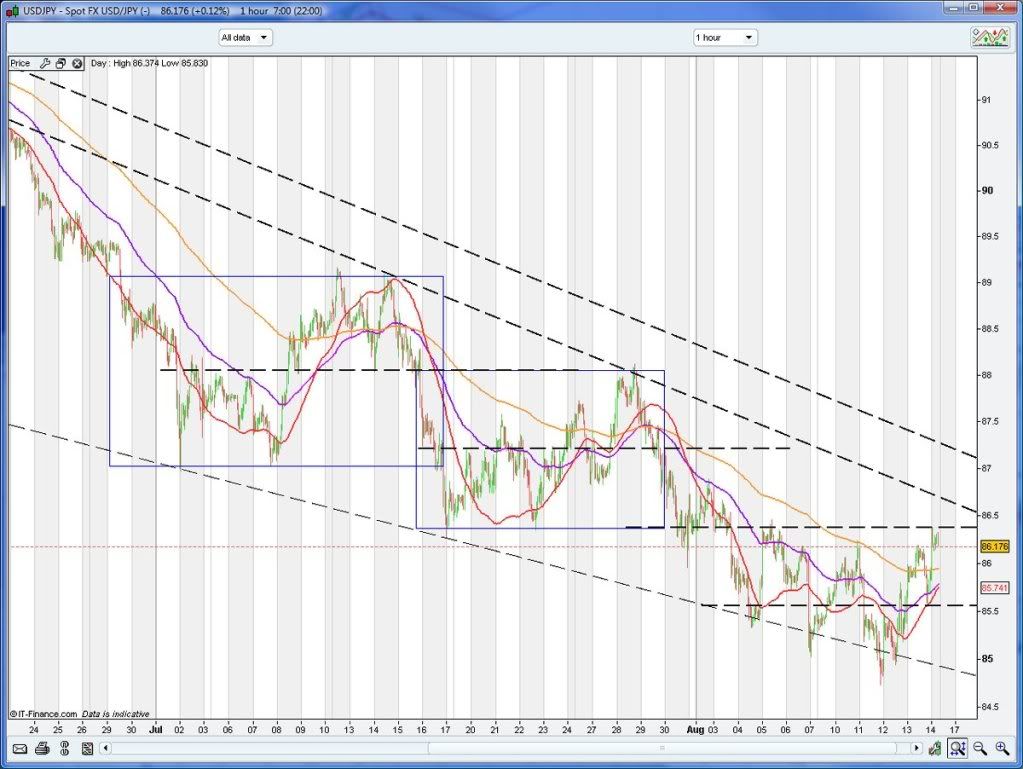
USDJPY daily chart - click to expand
USDJPY daily - click image

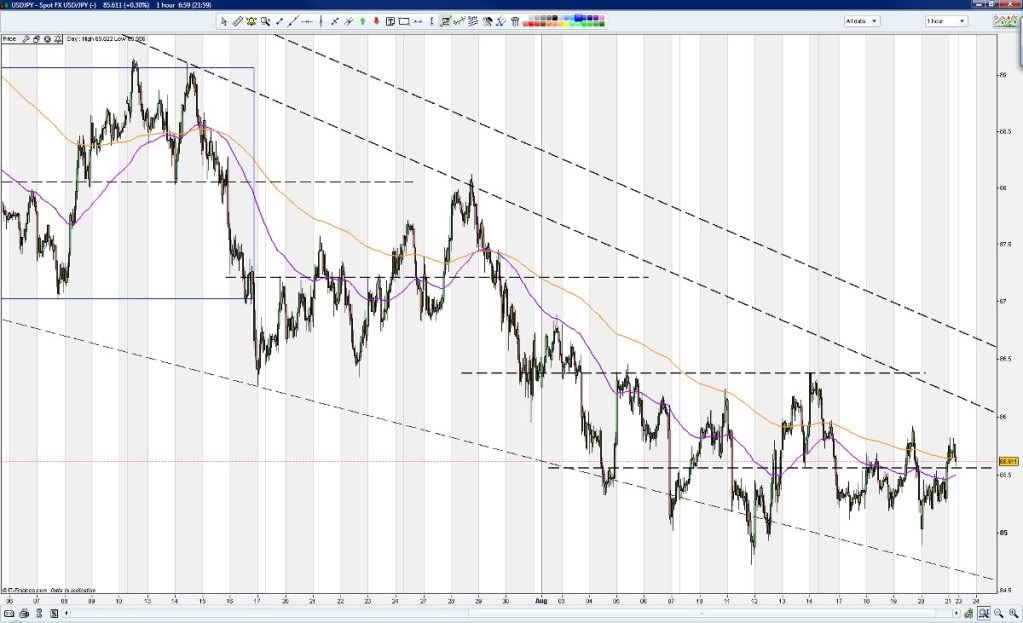
USDJPY 1hour chart - looking a treat! Easy-peasy ....
USDJPY 1hour - click image
(I'd brag about the beautiful short trade, but hadn't counted on the schizophrenic speculation!)

I still see the UJ chart trend as unlikely to be strength into the USD as repatriation was observable post Kobe - and I suggest the same this time around. Moreso since the Japanese Gov't has made commitments to reduce Gov't infrastructure spending in order to control public works expenditures. The Sendai earthquake is likely to undo this decision, however funds might come to the aid of the required restructure. The UJ pair has around 10% input into the value of the USDindex. This trend is less important for the purpose of the USD direction.

The recent volatility in the UJ is more reminiscent of the May2010 Flashcrash. In spite of the extended zero interest lending within the Yen since 1996, the Yen has continued to strengthen against the USD. Will be interesting if/when this long term trend ever changes - as with several other major pairs.

JPY COT data 22Mar2011 - here to view JPY COT chart
NOTE: JPY COT data indicates the inverse of the UJ trend, being the interest in the JPY component only
Open interest decreased marginally (-2,412 or -1.8%) to 131,550 (33% of previous peak 393,428 in Feb2007). The decrease was caused by a closing of both speculator group positions, Small Specs closing out 14.2% of their positions - an amount almost 2:1 over Large Specs, and mostly short positions (this would be losses). This results in Large and Small Specs in disagreement. Large Spes are 2.7:1 nett long Yen, Small Specs are only fractionally net short. Commercials increased their positions by 9.1% (to 43.2% of positions held) with adding mostly shorts, leaving the 2 spec groups control the remaining 56.8% of this market. Commercials are 1.8:1 nett short the Yen.


AUDUSD (AU)
- the AU is close to home. I am now long currently, having correctly opened shorts at 1.18 last time at these levels, but failed to capitalise properly on the recent 200pip dip down to 0.972 thinking it was going lower (idiot!!). For me long is expected to continue for now to at least daily overhead resistance at 1.036. (based on accepting the above downtrend continuation in the USDi). Broadly the AU recovered strongly to a trend breakdown in what is now a volatile sideways trend. A rising wedge is forming in the right hand edge of a cup formation. If support holds above 1.02, and 1.036 is breached, I expect somewhere up towards 1.10 to be a target for a reversal. Currently highly volatile and a swing traders dream (which I am yet to master properly).

AUDUSD daily chart - click to expand
AUDUSD daily - click image

AUDUSD 1hour chart -
AUDUSD 1hour - click image

Targets - currently long AU, so am bullish until the rising wedge fails. AU lower support is around 1.018/1.02. Bullish target is overhead resistance around 1.037. If it breaches 1,037, then 1.04, then 1.052 the median line of the channel. If it gets that far I'll be happy.

AUD COT data 22Mar2011 - here to view AUD COT chart
NOTE: AUD COT data indicates the same as the AU trend, being the interest in the AUD component only
Open interest this week remains wholely unchanged (+0.2% increase) at 109,078 (69% of previous peak 158,839 in Apr2010) - but OI has dropped significantly in the previous 3 weeks. This week sees Small Specs closing 14% of their positions (evenly) to remain nett long 1.8:1. Large specs and Commercials both increased their positions, with the single largest change being Commercials adding virtually all new shorts. These new short positions by Commercials (extending net short out to 4.8:1) were covered mainly by Large Specs (extending net long out to 6.8:1). Large and Small specs are 54.1 of this market and are both net long overall. Commercials increased their participation to 45.9% of AUD trading (remaining nett short). This supports a continuing trend in the AU for now. Comparison to the AU rally in Jun2008 indicates an increased likelihood of a trend change. Small speculators have reduced longs and shorts to remain long overall.


OVERALL SUMMARY

Current real issues are - Japan earthquake recovery and trade impacts, US trade and Government deficits, extended US housing/unemployment problems, PIIGS debt and trade burden for the EU, slow broader economic GDP growth, middle east unrest, financial regulations and the resulting level of speculation. The EUROzone has otherwise performed strongly thanks mainly to Germany against obvious and ongoing US economic weakness. A sustained low dollar policy is what the US would benefit the most from - hence why I doubt the US would be interested in intervening. It is the relative exchange strength of trading pairs that is hurting most outside the US.

Ignoring virtually everything in the news, the fundamentals of Germany's trading and recovery since GFC is exceptional. The larger monkey that is the remaining EUROzone debt problems coupled with what looks like capped growth opportunities is restraining an onslaught of EURO investment. But I think the EU will continue to strengthen overall among a background of otherwise ordinary opportunities.

Almost 12 months ago I thought there was an argument that private enterprise in unable to or (more likely) unwilling to commit large capital funding into asset prices due to weak consumer sentiment globally. I think some reluctance has overcome part of this issue, but it is yet to fully disappate.

The recent rallies in EU and GU since defy the proponents of global media calling for a recovery of the USD. This is despite impacts on trade from the commitment to cut back spending (austerity). There STILL remains no strength returning to the USD. Broadly lower open interests suggest everyone is waiting for decisive news to break. Since Aug2010 gold has increased in value 10%, and the USDi has dropped 9.2%.

We have clearly seen aspects of stagflation/deflation in spite of the new QE2 being tabled by the US. At best it remains a transitional market at the moment historically low Libors in CHF, YEN and USD providing cheap lending to those with access. The news for the EU is still generally more reasonable than that for the US - both have serious debt problems to overcome. The difference being that the EU has Germany as a powerhouse. Are Germany's opportunities reaching their limits?

I am suggesting at this point in time that this fall in the USD will continue on a weak bias to US economics over strength bias to EU.

Time will tell how decisive the next week moves in the USD are across various pairs. 77.0 is now overhead resistance and might be a ceiling for the USDi for a while until signs of real growth appear from somewhere. More volatility in trading is virtually assured with such low levels of lending available across various currencies.

regards to all, and safe trading
LH

Disclaimer: These are my personal opinions only. Any viewing or use of information provided by me is done so entirely at your own risk. I go to extensive efforts to ensure data available to me is up to date and accurate. I will not accept any liability for loss or damage arising from the above inclusive of errors, omissions or just plain ignorance. Trading can result in significant financial losses.

Sunday, August 22, 2010

USDi update 22Aug - combined format

USD index update
(now in combined format)

The USDi continued its upward breakout of the down channel to a new recent high of 83.30 and now sits above all daily EMA's. On Wed evening it tagged the 61.8%Fib retracement (of the recent breakout leg up) at 82.0 which is significant to me, as this was also the 200EMA on the daily. At the very least - unless the next move up fails at 83.40 (unlikely, but it is a daily resistance line) - this might be an ABC up correction (similar now to the EU movement down, shown below) within a larger overall down trend of the USDi. I suspect then this week will see more minor damage to the equity markets with the USDi target for C upleg being at least the length of A - which is a minimum of 85.1 for the USDi within the week.

The issue becomes - is this simply a USDi/EURO correction, or is something more problematic brewing? There is still the gap left at 81.0 which might provide a clue, as one day it will be filled. Currently the USDi trend is firmly upwards having now been confirmed by continuation through 82.80.

Presently, failure below 82.5 would restore buying into equities as the USDi trend has broken down. The USDi broke through the 61.8% Fib of the recent 2010 bull run at 83.20. A failure here remains bearish with a break now below 82.0 being below the daily EMA's again - but this is not likely now, daily indicators showing upwards with the USDi.

(USDi daily chart) - clickable
USD index daily - click image

The daily indicators RSI (breaking 50) and Stoch (above 0) suggest this rally will continue (is not overbought on either), so concern is real for equities with USDi moving into the danger zone with the USDi now above all daily EMA's.

Daily USDi chart on stockcharts.com - click here

(USDi hourly chart - updated retaining previous trend lines)
USD index 1hour - click image

Targets - 85.1 minimum; not sure if divergent tops in the RSI and Stoch's on rising USDi will show. Projected Fib indicated as an estimate. Daily MACD is below zero still, indicating this might just be an ABC correction only. Winks/WnL might comment on this?


THE COMPOSITE MAJOR PAIRS
According to my estimations, construction of the USDindex from the major pairs is roughly as follows - EURO 35%, CHF 35%, GBP 15%, JPY 10%, others 5%


EURUSD - now short for next week, in an ABC down

In reference to some EWave goings on regarding a possible ABC wave down (appendix below), an alternative to my previous update (thinking it was entering wave 4) - last week might have just seen B corrective up wave (in ABC down), which would mean C wave is yet to complete. Since C = A as a minimum EU has more downleg to come. Even if this is now a 5 waves down movement (1,2 just completed), then the EU will go below this projected level as C is not the shortest wave.

At this stage I'll go with ABC leg down - EU is now in C leg.


EU 1hour chart
EURUSD 1hour - click image

As noted last week, I didn't fall in love with the rally in the EU from last weeks low as it bounced off 1.273 on Monday morning. Staying short EU now would be the trade IMO. This strengthens the USDi in an opposite ABC upwards. If correct then, does this establish that leg A down finished equal with leg 4 - being the double bottom noted last week?

Targets - thinking only bearish for EU in a C leg down (assuming it is C)
C target = 1.234 (min), 1.198 (max) (in any case of either 5waves or ABC)

(now looking at this as a complete 5 waves to 1.333)
1.261 is the 50% Fib retracement of the recent 5 waves up, would be a shorter target
1.222 is the 23.6% Fib of the recent 5 waves up

USDCHF
The UC is in no mans land after it broke down below 1.037 to 1.027 - which puts it nowhere. It should continue sideways for the week in a new range within a high of 1.04 and a low of 1.02.

I continue to assume the UC is setting up the pattern for underwriting the direction of the USDi - which is further down (CHF getting stronger) in my opinion. But for the USDi to go lower after the current ABC corrective wave up then UC would need to at least hold, or go even lower on a rising EU. On the daily UC, a low of 1.012 is not unexpected which would allow this.

If the UC rises, it will cancel any effect of the EU rising and the result is USDi will hold steady. This will then show us if the equities are following the EU trend or the USDi proper. More time is needed to reveal this, but I suspect UC up with EU up giving a sideways USDi.

If the UC returns up and while the EU weakens further, the USDi will move up rapidly resulting in an equally sharp drop in equities and commodity prices. If the reason for this rise is fear, gold will rise with the USDi.

UC 1hour chart
- more weakness in the UC (a stronger CHF)
USDCHF 1hour - click image

1.04 is now resistance; support is at 1.0225 or lower at 1.012

GBPUSD
The GU range traded all last week, with weak a bearish trend. It broke sideways from the uptrend channel - and might now be in a similar ABC down correction with the EU.

A breakdown might be confirmed early in the week, with the trend sideways. It sits on the bottom edge of the channel presently.

GU 1hour chart - a collision of 2 channels resulting in failing up trend
GBPUSD 1hour - click chart

Targets -
If correct with a recent 5 waves up, leg 4 finished at 1.511, which would be a 50% Fib retracement support for the GU. GU failed to get above 1.573 after a small rally to 1.569 - just short of the 1.57 target last week.

Now clearly bearish - lower Fib retracements on the GU chart are the 61.8% Fib (1.532), which won't be breached easily, so am expecting a bounce from this level. Below this is the 50% Fib at 1.511 which shoud hold based on an ABC correction in the GU, if this is correct.

USDJPY
UJ 1hour chart - remains within a trading band. The UJ is a combination of strong downward channel and falling wedge. Each time resulting in a lower swing bottom. Is it bottoming this time? Still .... what does it mean? The Yen is getting stronger still - this is not helping Japan's current economic problems and is likely to weaken in the short term.


USDJPY 1hour - click image


The UJ neckline setup at 86.37 with a support below at 85.56 failed and the UJ is range trading sideways with no decisive up or down direction at all (consolidation). 86.37 remains as an upper bound, with 85 below it. This could be Japan electing to weaken the Yen - if demand remains for the Yen (strengthening it), it confirms to me its role as a primary trading currency in high demand.

I still see the UJ chart trend as unlikely to be strength in the USD - as the daily shows that 84.0 is likely (as weakness in the USD). The UJ pair has around 10% input into the value of the USDindex. This trend is less important for the purpose of the USD direction.


A SUMMARY -
There remains plausible explanations for the ongoing weakness in the EU and GU based on impacts on trade from the commitment to cut back spending (austerity). Is strength returning to the USD? Still no real strength to speak of in the USD. It's now a bit more than simply profit taking (in the EU and GU) and economic fear might be building - but for stagflation/deflation reasons.

It is like there is no alternative activity and everything above is showing signs of disinterest - waiting for decisive news to break. Monday I think will be quiet all round until the news on the EUR trade figures. UC and UJ are not doing anything remarkable to show underlying strength in the USD. Gold prices have sustained on the rising USD which is an indication to me more of fear in the markets.

Movement down in the EU and GU is not accompanied by any real move in the UC and UJ. Hence the EU and GU so far are the only cause for the rise in the USDi. This theme should continue next week with the moves indicated above (if I am reading it correctly).

Fear might be taking hold however stagflation/deflation remains the only reality unless a new QE2 is tabled. At best its a transitional currently market it the moment with no clear direction to speak of. The news for the EU and GU pairs is still more reasonable than that for the US.

I am suggesting at this point in time that this rally in the USD will continue up on weakening EU and GU - breaking above 83.5 - meaning equities would likely dip. The main danger remains as continued weakening of the EU and GU at this point in time.

Time will tell how decisive these moves are. Maybe 80cents is the floor on the USDi for a while until signs of growth appear from somewhere. This results in more choppy side trading to come.

rgds,
pw


APPENDIX - EWave assumptions on corrective (ABC) waves are as follows.-

Wave A (Has five sub waves 1, 2, 3, 4, 5)
Wave B (Has three sub waves namely wave A, B and C)
Wave C (Has five sub waves 1, 2, 3, 4, 5)

Corrective cycle may see all levels which are seen already up to wave 4 previously
Correction ends just above the level of wave 4. (but not always?)
Correction occurs in three waves, A, B and C - C wave's length is the same as A wave at least or 1.618 times A wave.

Saturday, August 21, 2010

Hindenburg Omen confirmations

"The Hindenburg Omen is a combination of technical factors that attempt to measure the health of the NYSE, and by extension, the stock market as a whole. The goal of the indicator is to signal increased probability of a stock market crash.

The rationale is that under "normal conditions" either a substantial number of stocks may set new annual highs or annual lows, but not both at the same time. As a healthy market possesses a degree of uniformity, whether up or down, the simultaneous presence of many new highs and lows may signal trouble."

Here's a few charts you will find interesting ... using the H/L ratios of NYSE and NASDAQ. The period of Jul/Aug 2004 is a comparison at the moment.

Many markets are very choppy and sideways currently (20Aug2010) - so watch for any failure of the lower horizontal support. Lower looks highly likely from current levels.

H/L ratio is the EMA34 blue and EMA190 red (the actual signal is way to0 choppy and noisy). SPX (red) and NDX COMP (blue) in the background of each chart - 12 year history provided below to show how this compares with recent recoveries.

NYSE using NYHLR - note the 2 lines of support shown,
upper = 3.12, lower = 1.32 => lower is more important


The recent NYSE NYHLR signal you can get here (note the ratio can go to zero)

Nasdaq seems to have a reliable history of trending H/L ratio -
Upper = 1.0, Lower = 0.625 => lower line is more important


Nasdaq H/L approaching the first point of concern. Whether it fails the lower line or not is going to be interesting. We'll se it in the a double bottom of SPX at 1010 if it holds - assuming SPX breaks below 1070 this week. Up above it is always a positive.

The recent NASDAQ H/L Ratio signal you can get here (note the ratio can go to zero)

It's hard to argue with 2 large equity markets that pull the strings in AUS. One day we might grow up ....

It supports the little known fact that markets top out on neutral underlying stock performance - that is stocks top before the market tops.

Then of course, it also means the market does not top 'until' the stocks have topped. Food for thought in choppy sideways markets - but be cautious nonetheless. Perhaps hold but don't sink more into it until it shows clear improvement.

The clincher of course is that stocks are already underperforming by the time the indexes show it. Hence trust your instincts more than you trust the news. If you think enough stocks have support, you might elect to stay in.

rgds,
pw

PS. An idea borrowed from the boys at BreakPoint Trades (they use the NYSI cumulative) - who are worthwhile following


The recent NYSE NYSI Ratio signal you can get here

Fibonacci levels explained

While many would undoubtedly be aware of the Fibonacci sequence, and the technical use of Fibonacci (Fib) levels, here is a complete picture of how they are derived.

(no tricks were used in the making of this post, it uses numbers and basic calculations only)

FIBONACCI SEQUENCE and calculating Fib levels
Click image for larger view

Virtually everyone uses the 61.8, 50.0 and 38.2 Fib levels many times a day. Lessor known (but equally valid) Fib levels are 33.3, 20.0 etc from above

50% Fib - when applied to a range, is simply an average of that range (a mean price).

A lessor known rule for calculating Fibs (for when you cannot remember) is simply multiply 61.8% by itself (0.618x0.618)x100% = 38.2, and again = 23.6% etc

Now this is where it might get interesting -
More accurately, the primary FIB level of 61.8% is actually 0.618033989 (can see where I got this above at (**)). Add 1 to the primary Fib and you have the Golden Ratio (GR).

Major Fib level = 1/GR = GR - 1

So in order of decreasing Fib levels the actual sequence is -

(retraction levels, applied to a 100% range)
61.80%
50.00% = 1/2 (half) = an average price
38.20%
33.33% = 1/3 (third)
23.61%
20.00% = 1/5 (fifth)
14.59%
etc

Fib projections (beyond a range) simply add 100% to these numbers)
161.8%
150.0%
138.2% etc

Calculating Fib levels from the Fib sequence is simple enough. First create a sequence of divisions of consecutive pairs. Then skip one, and divide every second one. Then skip 2 and divide every third one etc etc.

You will then find each successive Fib level to be itself x 0.618 (rounding off). But linked to the Golden ratio.

Spooky hey? (:o)
Enjoy.

rgds,
pw

Wolfram Mathworld on the Golden Ratio
Wiki on the Golden Ratio

"The golden ratio, also known as the divine proportion, golden mean, or golden section, is a number often encountered when taking the ratios of distances in simple geometric figures such as the pentagon, pentagram, decagon and dodecahedron. "

Sunday, August 15, 2010

USDindex major pairs - 15Aug2010

USDindex major pairs - EU, UC, GU, UJ
(all charts are clickable)

In consideration of possible impacts from austerity on the EU and GU with possible weaknesses forming in these 2, the UC and UJ pairs need to likewise show weakness in CHF and JPY for the USDi to be considerably stronger than were it is. Looking into each of these 4 major pairs provides more consideration for what the USDi might do based on what these each needs to do.

EURUSD
Possible impacts from spending/credit cutbacks might explain some recent weakness in the EU and GU pairs. Otherwise the data looks positive im comparison to anything else on the market.

Until some consolidation is seen from this sharp drop, the current EU trend is down. Good for USDi and bad for equities. Daily, the EU had a 250pip drop in 24hrs, which is large by any stretch, so a quick snap back up might be in order. If the EU continues to fail, then it is contrary to popular opinion and must be respected.

EU is starting to bunch up, and a believer might go long from tomorrows low if around 1.273 on divergences alone even if it gaps down. Sharp changes can have sharp reversals - above 1.285 would be reason to go long EU with at least a 1.30 target. (means USDi is topping also)

Is this leg 4 down of 5 waves up? After exceeding a target of 1.33 being the underside of a consolidation channel (either side of 50%Fib of the recent fall from the Dec2009 high). A double bottom may have formed at 1.274 with minor divergences forming on the 1hour. Is this forming a H&S at 1.274 now and will this continue a bull run to above 1.33?

EU hourly


I wouldn't fall in love with any rally in the EU from current levels, but a spec long might be in order if 1.275 holds and 1.28 is broken at close of tomorrow.

Targets -
If bullish , the 61.8%FIB retracement is 1.278 if this double bottom holds. It is a risk to go long from the current level on a double bottom only with little divergence - but I am at a loss to explain any better why the USDi is rallying. Otherwise the 50%Fib retrac is down at 1.260, or the 23.6% Fib retrac of the overall larger fall from Dec2009 is 1.265. No other levels have held so far.

This could possibly be the end of a wave 4 down to wave 5 top around 1.36 (or 50%Fib retrac of 1.35) if the EU turns bullish from here. (Bad for the USDi and good for equities). The gaps tomorrow should be interesting.

If bearish, then the top is in and the same levels above apply for a bear rally in the EU in an optimistic case for a small rally, and the double bottom presently might fail. Would be looking for a low as low as 1.245 before a small bear rally. Possibly a major EUR dysfunction in spite of the +ve spin if this is the case and a double dip might be on the way.

USDCHF
The UC remains intriguing, as it is still trapped in a trading range. 1.05 remains the magic number of the band it is trading in. The slightly bullish pennant forming for some direction - however neckline at 1.055 is raising the level for a bullish breakout. Long above 1.055 with a 1.065 target, short below 1.047 with a 1.037 target.

The UC is setting up the pattern for underwriting the direction of the USDi in my opinion. If the USD becomes a flight to safety, the UC should go up from this area in all likelihood. It's bunching is a reflection of indecision - weakly bullish of late. Has broken out of the recent downtrend and is trading sideways.

UC 1hour chart (updated from previous) - yet another decision time


1.05 is presently holding up.

GBPUSD
The GU is classic edge of your seat stuff. It remains crawling up the inside of the rising from the May2010 low, and has just hung onto a lessor known support level of 1.557 while so far avoiding the 50% retracement level of 1.555. Showing good divergences on the 1hour, can it return up from here?

Until a breakdown is confirmed, it remains in an upward channel after a relatively mild retrace. It sits on the edge of both channels presently - will it hold and return to +ve territory?

GU 1hour chart - a collision of 2 channels at recent support


While GU has held just above the 50% retracement level of 1.555 so far (from the drop from Nov2009 high) it's hard to see it not a least testing this level or a previous neckline of 1.544 (a stronger support). Like the EU, I won't fall in love with any GU rally from this level, but a long might be a low risk using the rising channel to provide stop limits and the 1.555 as support.

Targets -
If bullish, could this be a wave 4 down? Needs t0 get back above 1.573 from here to stand a chance of this. A bullish target would be 1.62 if this GU pullback is ending. If bearish, the 61.8%Fib is at 1.532 - however GU is currently testing a recent support at 1.555 which needs to fail first. Below this is a nice solid neckline at 1.530 which looks stronger still. Hard to see GU getting belted far below this for now on present news. The drop in the GU has not been as sharp as the EU, and a small rally to 1.57 might take place from here if the channel holds.

If bearish - Maybe the austerity concerns get revisited due to adverse employment and output data as a result of cutbacks. This argument holds for the EU also. Look for lower Fib retracements on the GU chart, however I would expect the thick dotted support lines to offer some strong support. I wouldn't expect the 61.8% Fib to be breached easily.

USDJPY
UJ 1hour chart - entering another trading band, but UJ is a combination of strong downward channel and falling wedge. Each time resulting in a lower swing bottom. Is it bottoming this time? If it is, what does it mean?


UJ has another clear neckline formed at 86.37 with a support below this at 85.56. While the UJ is not overbought, it requires more consolidation and/or a defined upwards move. This could be Japan electing to weaken the Yen as a strong yen at these levels will be hurting the terms of trade for Japan on reduced demand, without an alternative consumer market.

While Japan is actively seeking alternative markets for it's output, is alternative consumption available in volumes sufficient to support the maintaining of a strong Yen? Again, the UJ chart is unlikely to be strength in the USD, but it all adds up. The UJ pair has around 10% input into the value of the USDindex. So this trend is less important for the purpose of the USD direction.

The downtrend channels of the UJ shown needs to be broken decisively for the fear factor to appear in this pair. Otherwise the UJ chart could show Japan allowing it's currency depreciate while sorting out better terms of trade in a weak US economy, or it could more demand for Yen in carry trade.

A SUMMARY?
On the whole, there are plausible explanations for the recent weakness in the EU and GU based on impacts on trade from the commitment to cut back spending. Is this strength in the USD? Not at all, it could simply be profit taking. Fear of the economy should be showing up in the UC, and also the UJ. These 2 appear weak in comparison to the decisive movements in the EU and GU. A casual eye over the forming of bottoms, and any decisive and continued breakout from the consolidation of the UC (primarily) and UJ (secondary) might be more indicative of growing fear factor.

Rising UJ shows more demand for USD in preference to the Yen, however I don't think Japan would prevent the appreciation of the USD against the Yen in order to assist Japans terms of trade with the US.

Sustained gold prices would be more of an indication of fear in spite of a growing USD. If the USD does rise in UC and UJ without fear because of depreciation in the Yen and CHF, then the rising USD would cause the price of gold (and commodities) to fall doubly because of a lack of fear, and with the rising USD.

Any rallying in the EU would likely counteract this if the EU regains it's bullish rally. Hence the USD can appreciate against the CHF and Yen which would be adequately covered by a return to gains in the EU and GU. This would result in an equities rally with nil change to the USD. There is nothing whatever binding the UC and UJ to be opposite to EU and GU.

Clearly, I think if fear is to take hold, EU (primarily) and GU (secondary) will continue down on economic doubts, then you might find gold will hold it's own against a rising USD in this instance due to the fear factor. If deflation somehow becomes a reality (extremely slim chance), then I would expect all assets to depreciate (incl gold), with the USD becoming a safehaven of last resort.

I am suggesting at this point in time that this rally in the USD will prove to be short lived - at worst neutral to sideways for the next 2 weeks only if 81.6 holds, while remaining below 83.5 - meaning equities would return to +ve territory also. The main danger really appears to be any continued weakening of the EU and GU at this point in time.

Therefore is it possible to go long all 4 of these or short all these? Yes, they each appear independent (and should be handled/traded as such) in determining an overall direction for the USDi. The largest impacts are noticed in movements of the UC and EU.After all is said above, maybe the world is heading to hell in a hand basket. Time will tell.


rgds,
pw