(all charts are clickable)
In consideration of possible impacts from austerity on the EU and GU with possible weaknesses forming in these 2, the UC and UJ pairs need to likewise show weakness in CHF and JPY for the USDi to be considerably stronger than were it is. Looking into each of these 4 major pairs provides more consideration for what the USDi might do based on what these each needs to do.
EURUSD
Possible impacts from spending/credit cutbacks might explain some recent weakness in the EU and GU pairs. Otherwise the data looks positive im comparison to anything else on the market.
Until some consolidation is seen from this sharp drop, the current EU trend is down. Good for USDi and bad for equities. Daily, the EU had a 250pip drop in 24hrs, which is large by any stretch, so a quick snap back up might be in order. If the EU continues to fail, then it is contrary to popular opinion and must be respected.
EU is starting to bunch up, and a believer might go long from tomorrows low if around 1.273 on divergences alone even if it gaps down. Sharp changes can have sharp reversals - above 1.285 would be reason to go long EU with at least a 1.30 target. (means USDi is topping also)
Is this leg 4 down of 5 waves up? After exceeding a target of 1.33 being the underside of a consolidation channel (either side of 50%Fib of the recent fall from the Dec2009 high). A double bottom may have formed at 1.274 with minor divergences forming on the 1hour. Is this forming a H&S at 1.274 now and will this continue a bull run to above 1.33?
EU hourly
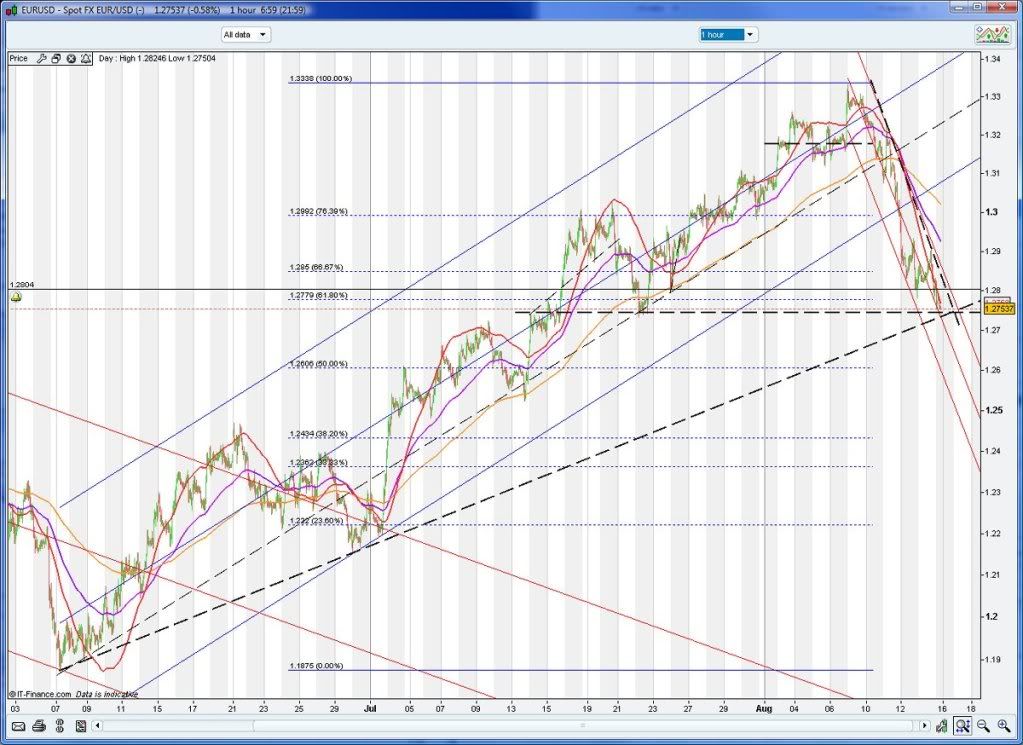
I wouldn't fall in love with any rally in the EU from current levels, but a spec long might be in order if 1.275 holds and 1.28 is broken at close of tomorrow.
Targets -
If bullish , the 61.8%FIB retracement is 1.278 if this double bottom holds. It is a risk to go long from the current level on a double bottom only with little divergence - but I am at a loss to explain any better why the USDi is rallying. Otherwise the 50%Fib retrac is down at 1.260, or the 23.6% Fib retrac of the overall larger fall from Dec2009 is 1.265. No other levels have held so far.
This could possibly be the end of a wave 4 down to wave 5 top around 1.36 (or 50%Fib retrac of 1.35) if the EU turns bullish from here. (Bad for the USDi and good for equities). The gaps tomorrow should be interesting.
If bearish, then the top is in and the same levels above apply for a bear rally in the EU in an optimistic case for a small rally, and the double bottom presently might fail. Would be looking for a low as low as 1.245 before a small bear rally. Possibly a major EUR dysfunction in spite of the +ve spin if this is the case and a double dip might be on the way.
USDCHF
The UC remains intriguing, as it is still trapped in a trading range. 1.05 remains the magic number of the band it is trading in. The slightly bullish pennant forming for some direction - however neckline at 1.055 is raising the level for a bullish breakout. Long above 1.055 with a 1.065 target, short below 1.047 with a 1.037 target.
The UC is setting up the pattern for underwriting the direction of the USDi in my opinion. If the USD becomes a flight to safety, the UC should go up from this area in all likelihood. It's bunching is a reflection of indecision - weakly bullish of late. Has broken out of the recent downtrend and is trading sideways.
UC 1hour chart (updated from previous) - yet another decision time
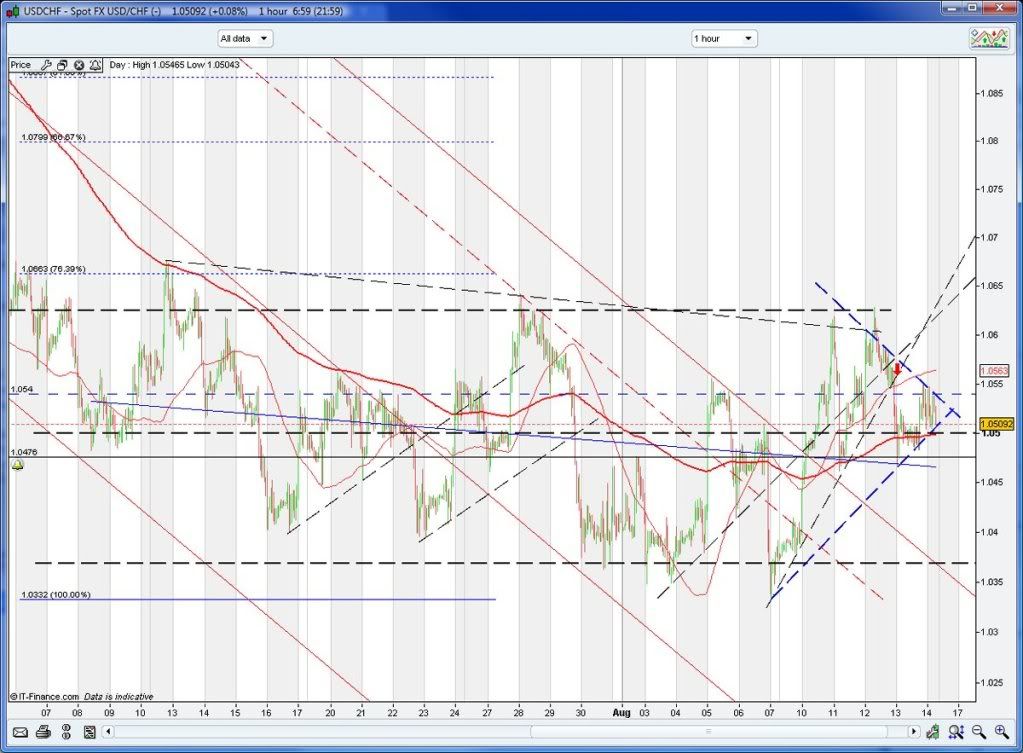
1.05 is presently holding up.
GBPUSD
The GU is classic edge of your seat stuff. It remains crawling up the inside of the rising from the May2010 low, and has just hung onto a lessor known support level of 1.557 while so far avoiding the 50% retracement level of 1.555. Showing good divergences on the 1hour, can it return up from here?
Until a breakdown is confirmed, it remains in an upward channel after a relatively mild retrace. It sits on the edge of both channels presently - will it hold and return to +ve territory?
GU 1hour chart - a collision of 2 channels at recent support
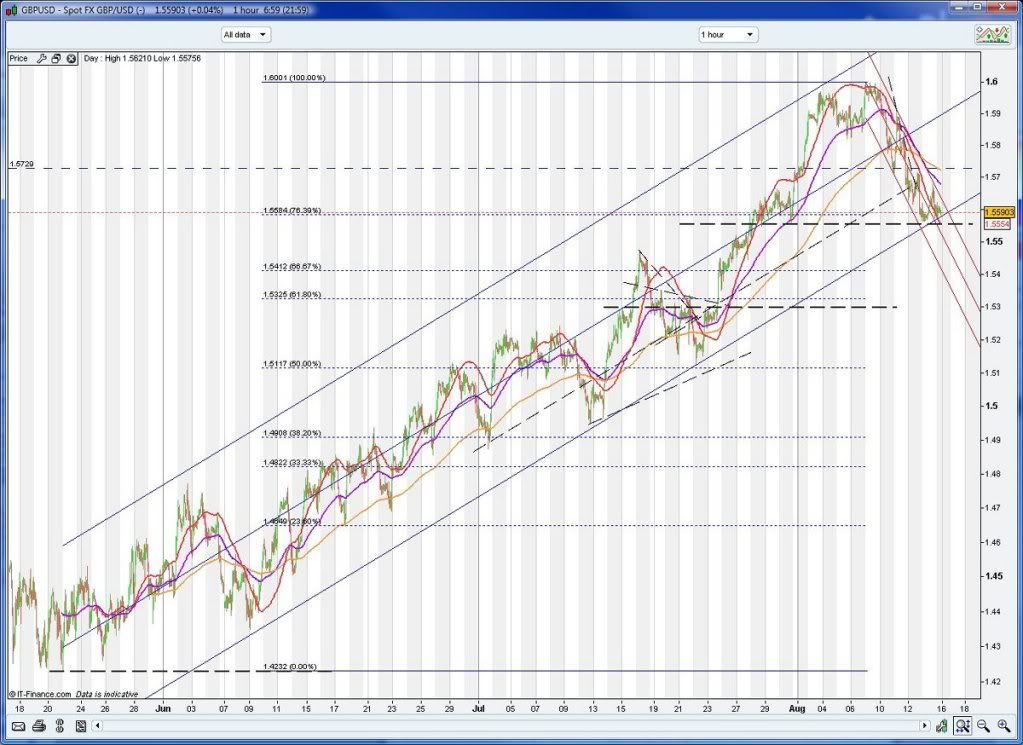
While GU has held just above the 50% retracement level of 1.555 so far (from the drop from Nov2009 high) it's hard to see it not a least testing this level or a previous neckline of 1.544 (a stronger support). Like the EU, I won't fall in love with any GU rally from this level, but a long might be a low risk using the rising channel to provide stop limits and the 1.555 as support.
Targets -
If bullish, could this be a wave 4 down? Needs t0 get back above 1.573 from here to stand a chance of this. A bullish target would be 1.62 if this GU pullback is ending. If bearish, the 61.8%Fib is at 1.532 - however GU is currently testing a recent support at 1.555 which needs to fail first. Below this is a nice solid neckline at 1.530 which looks stronger still. Hard to see GU getting belted far below this for now on present news. The drop in the GU has not been as sharp as the EU, and a small rally to 1.57 might take place from here if the channel holds.
If bearish - Maybe the austerity concerns get revisited due to adverse employment and output data as a result of cutbacks. This argument holds for the EU also. Look for lower Fib retracements on the GU chart, however I would expect the thick dotted support lines to offer some strong support. I wouldn't expect the 61.8% Fib to be breached easily.
USDJPY
UJ 1hour chart - entering another trading band, but UJ is a combination of strong downward channel and falling wedge. Each time resulting in a lower swing bottom. Is it bottoming this time? If it is, what does it mean?
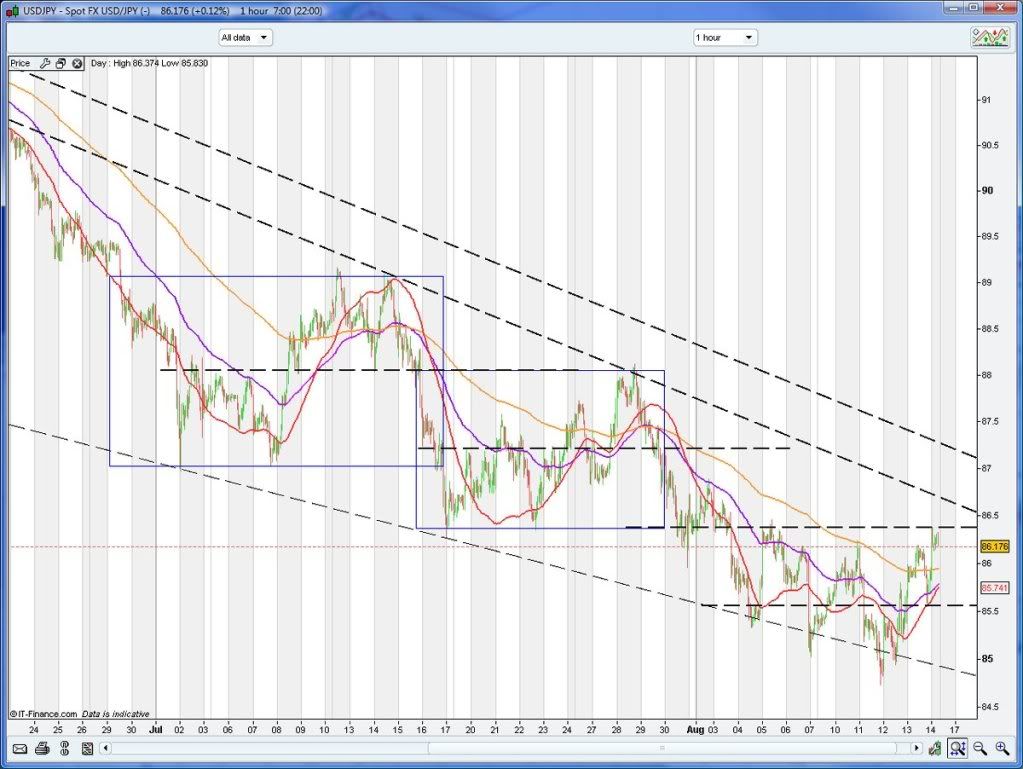
UJ has another clear neckline formed at 86.37 with a support below this at 85.56. While the UJ is not overbought, it requires more consolidation and/or a defined upwards move. This could be Japan electing to weaken the Yen as a strong yen at these levels will be hurting the terms of trade for Japan on reduced demand, without an alternative consumer market.
While Japan is actively seeking alternative markets for it's output, is alternative consumption available in volumes sufficient to support the maintaining of a strong Yen? Again, the UJ chart is unlikely to be strength in the USD, but it all adds up. The UJ pair has around 10% input into the value of the USDindex. So this trend is less important for the purpose of the USD direction.
The downtrend channels of the UJ shown needs to be broken decisively for the fear factor to appear in this pair. Otherwise the UJ chart could show Japan allowing it's currency depreciate while sorting out better terms of trade in a weak US economy, or it could more demand for Yen in carry trade.
A SUMMARY?
On the whole, there are plausible explanations for the recent weakness in the EU and GU based on impacts on trade from the commitment to cut back spending. Is this strength in the USD? Not at all, it could simply be profit taking. Fear of the economy should be showing up in the UC, and also the UJ. These 2 appear weak in comparison to the decisive movements in the EU and GU. A casual eye over the forming of bottoms, and any decisive and continued breakout from the consolidation of the UC (primarily) and UJ (secondary) might be more indicative of growing fear factor.
Rising UJ shows more demand for USD in preference to the Yen, however I don't think Japan would prevent the appreciation of the USD against the Yen in order to assist Japans terms of trade with the US.
Sustained gold prices would be more of an indication of fear in spite of a growing USD. If the USD does rise in UC and UJ without fear because of depreciation in the Yen and CHF, then the rising USD would cause the price of gold (and commodities) to fall doubly because of a lack of fear, and with the rising USD.
Any rallying in the EU would likely counteract this if the EU regains it's bullish rally. Hence the USD can appreciate against the CHF and Yen which would be adequately covered by a return to gains in the EU and GU. This would result in an equities rally with nil change to the USD. There is nothing whatever binding the UC and UJ to be opposite to EU and GU.
Clearly, I think if fear is to take hold, EU (primarily) and GU (secondary) will continue down on economic doubts, then you might find gold will hold it's own against a rising USD in this instance due to the fear factor. If deflation somehow becomes a reality (extremely slim chance), then I would expect all assets to depreciate (incl gold), with the USD becoming a safehaven of last resort.
I am suggesting at this point in time that this rally in the USD will prove to be short lived - at worst neutral to sideways for the next 2 weeks only if 81.6 holds, while remaining below 83.5 - meaning equities would return to +ve territory also. The main danger really appears to be any continued weakening of the EU and GU at this point in time.
Therefore is it possible to go long all 4 of these or short all these? Yes, they each appear independent (and should be handled/traded as such) in determining an overall direction for the USDi. The largest impacts are noticed in movements of the UC and EU.After all is said above, maybe the world is heading to hell in a hand basket. Time will tell.
rgds,
pw
No comments:
Post a Comment