The rationale is that under "normal conditions" either a substantial number of stocks may set new annual highs or annual lows, but not both at the same time. As a healthy market possesses a degree of uniformity, whether up or down, the simultaneous presence of many new highs and lows may signal trouble."
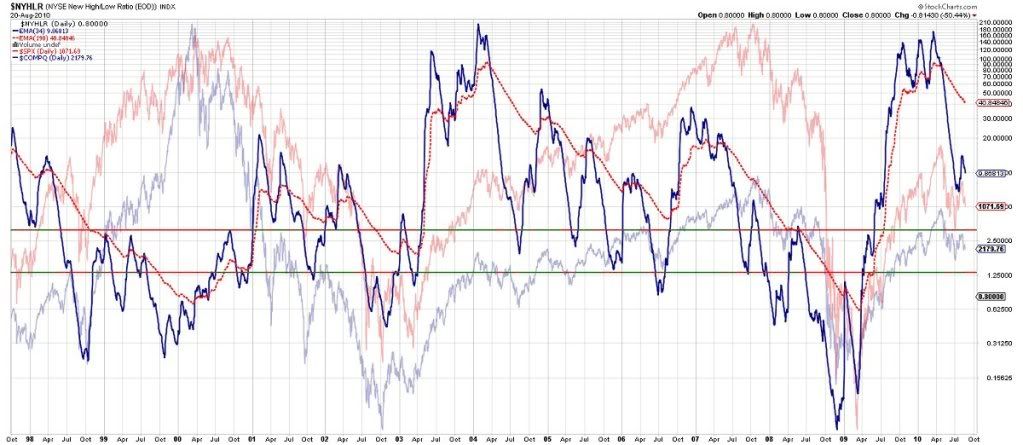
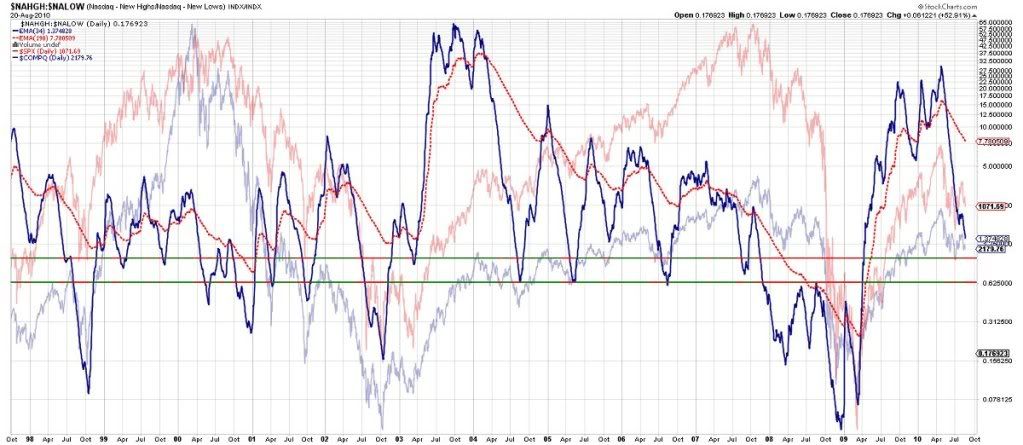
Here's a few charts you will find interesting ... using the H/L ratios of NYSE and NASDAQ. The period of Jul/Aug 2004 is a comparison at the moment.
Many markets are very choppy and sideways currently (20Aug2010) - so watch for any failure of the lower horizontal support. Lower looks highly likely from current levels.
H/L ratio is the EMA34 blue and EMA190 red (the actual signal is way to0 choppy and noisy). SPX (red) and NDX COMP (blue) in the background of each chart - 12 year history provided below to show how this compares with recent recoveries.
NYSE using NYHLR - note the 2 lines of support shown,
upper = 3.12, lower = 1.32 => lower is more important

The recent NYSE NYHLR signal you can get here (note the ratio can go to zero)
Nasdaq seems to have a reliable history of trending H/L ratio -
Upper = 1.0, Lower = 0.625 => lower line is more important

Nasdaq H/L approaching the first point of concern. Whether it fails the lower line or not is going to be interesting. We'll se it in the a double bottom of SPX at 1010 if it holds - assuming SPX breaks below 1070 this week. Up above it is always a positive.
The recent NASDAQ H/L Ratio signal you can get here (note the ratio can go to zero)
It's hard to argue with 2 large equity markets that pull the strings in AUS. One day we might grow up ....
It supports the little known fact that markets top out on neutral underlying stock performance - that is stocks top before the market tops.
Then of course, it also means the market does not top 'until' the stocks have topped. Food for thought in choppy sideways markets - but be cautious nonetheless. Perhaps hold but don't sink more into it until it shows clear improvement.
The clincher of course is that stocks are already underperforming by the time the indexes show it. Hence trust your instincts more than you trust the news. If you think enough stocks have support, you might elect to stay in.
rgds,
pw
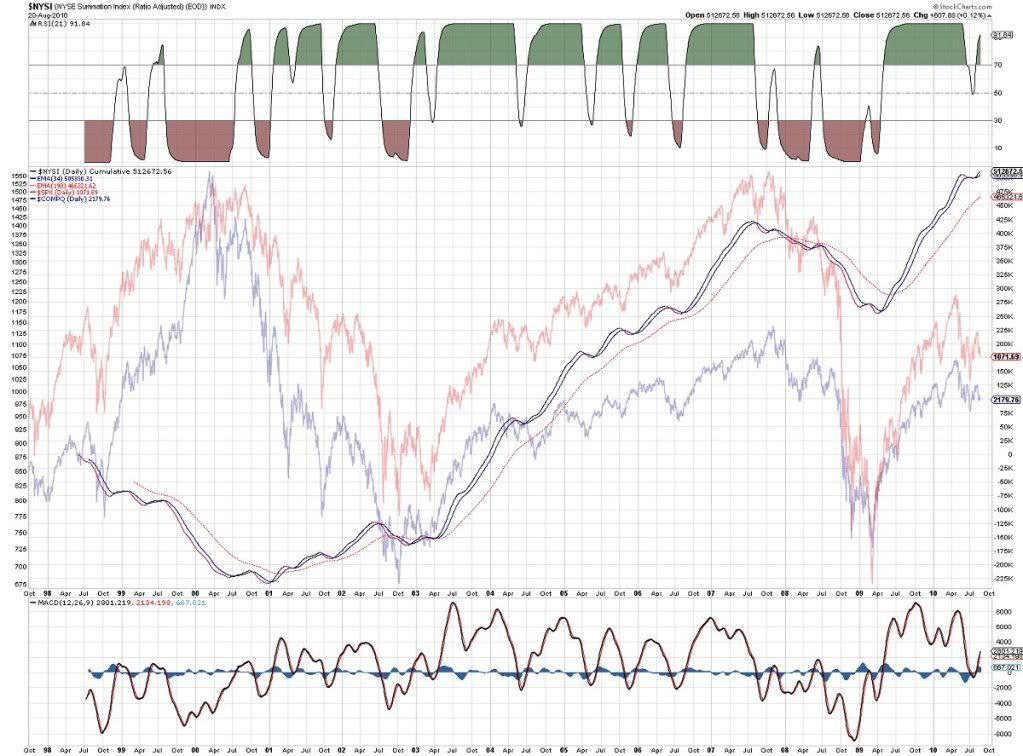
PS. An idea borrowed from the boys at BreakPoint Trades (they use the NYSI cumulative) - who are worthwhile following

The recent NYSE NYSI Ratio signal you can get here
No comments:
Post a Comment